After reading through the Technologist module, I felt like I learned more about my own learning style than I did ab out digital literacy and design thinking. For me, hyperlinks are distracting and I tend to not interact with them very much. I like to have a specific focus when learning about a new topic, and clicking on a hyperlink makes me feel like I’m going on a digital tangent. I don’t want to lose my place in the original text I’m reading, so I don’t usually click on hyperlinks that will lead me to a whole other world of information. Furthermore, I often found myself ignoring the “extend activities”, because they felt like extra information that was not necessary for me to understand the module.
 My favourite part of the module was the video What is Design Thinking (speaking of hyperlinks…). This video was great because it showed a real life example of what design thinking can look like. The video was also easy to follow and visually appealing. However, I struggled to see how it could be applied to a typical classroom teacher. I couldn’t see many teachers spending their limited free time designing an entirely new category of technology. Most teachers (including myself) would have no idea how to even go about doing so because we have no idea how electronic devices are built and programmed. I liked the idea of creating a post-it note prototype, but then where do we go from there? Overall, the video was a great description of design-thinking but it seems impractical for the typical classroom teacher.
The platform I decided to use was Piktochart. I started this assignment by using Canva, but after struggling with formatting issues for several minutes, I decided to go back to good ol’ Piktochart. I have used Piktochart in the past for a multimedia reflection and I really enjoyed it. It is easy to use, and the template is flexible. The only annoying thing is you cannot change the colour scheme for some templates (of course). I decided to use images instead of icons for this infographic, and I found that Piktochart had a variety of high quality photos available to use. I sometimes struggled with finding the exact picture I wanted, but in the end I managed to find some that worked well.
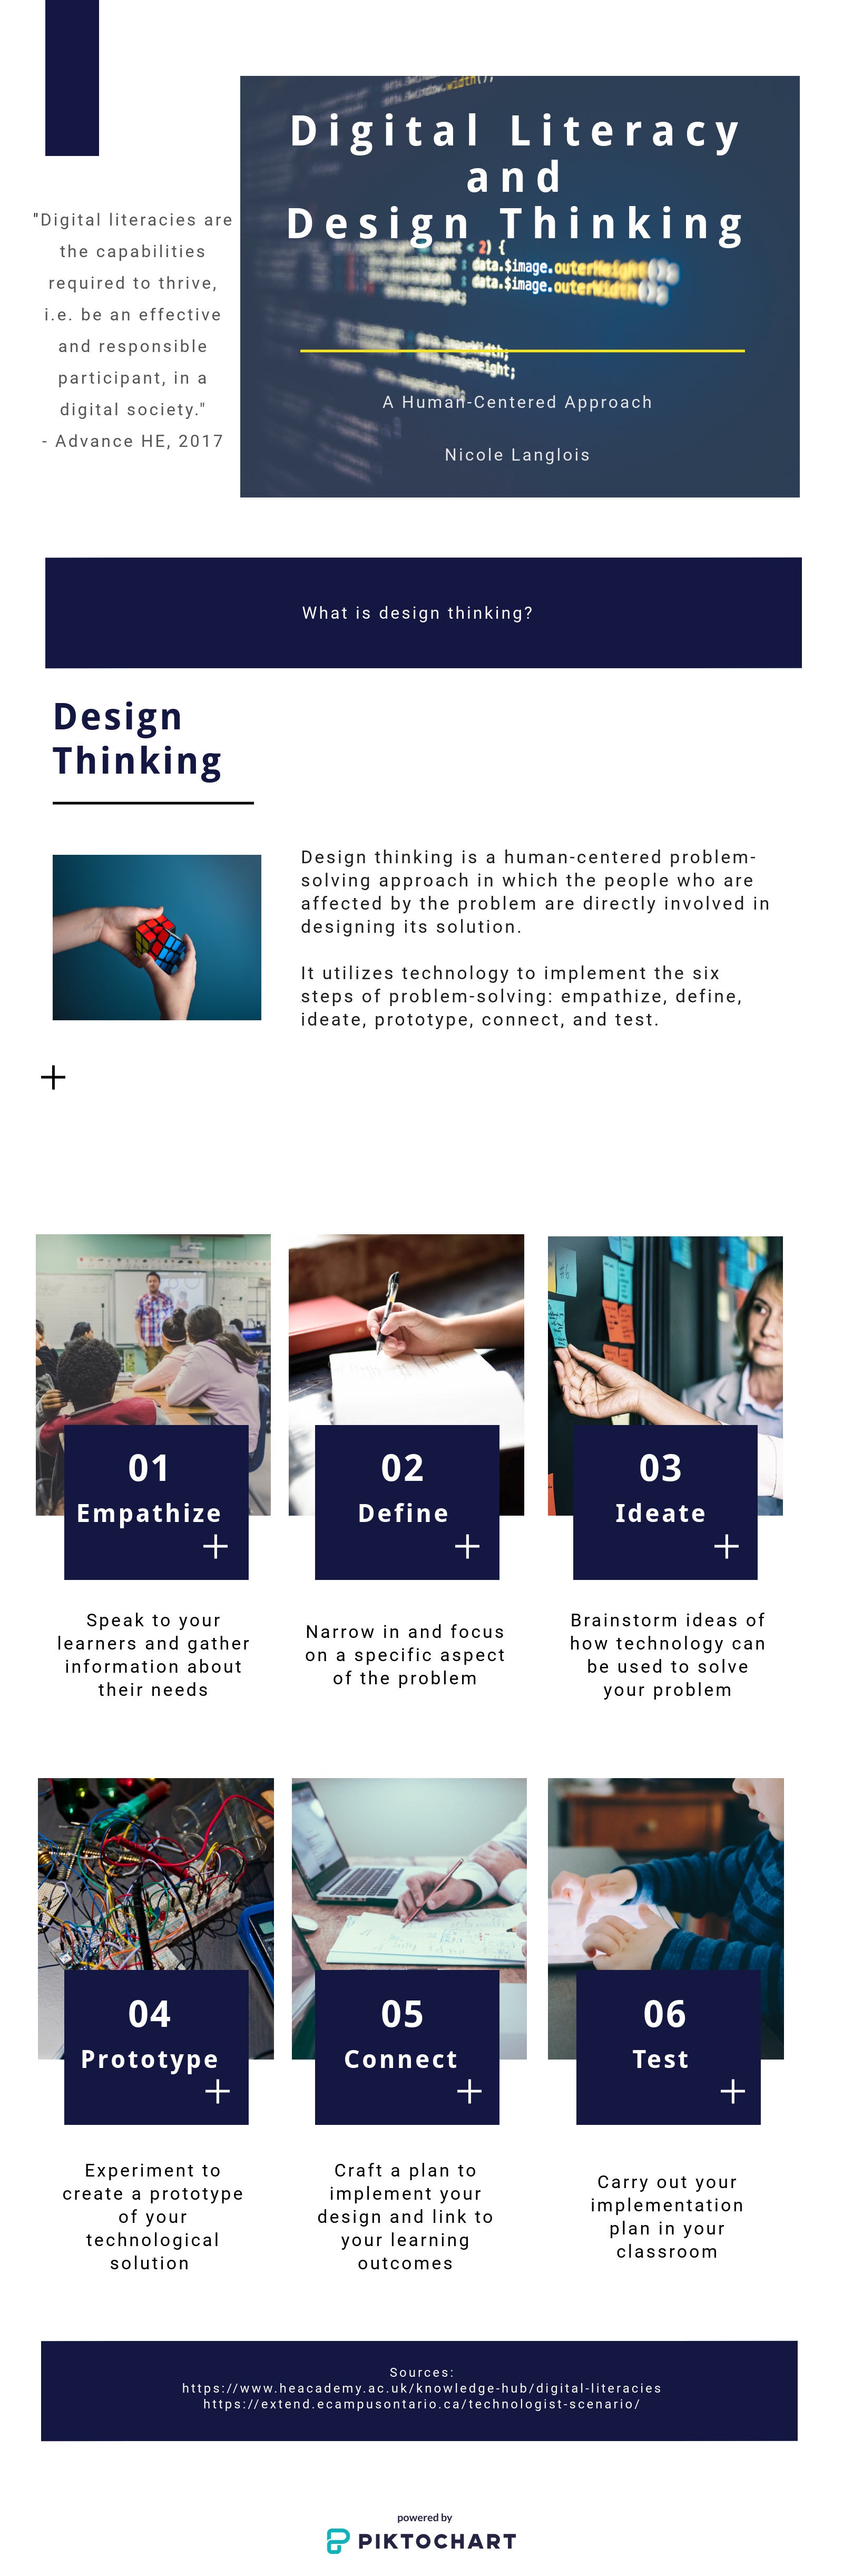
Overall, though I like the concept of design thinking, I didn’t really enjoy working through the online module. Enjoy my infographic below, which summarizes the main points of the module.
Thanks for reading!
Nicole Langlois