For this multimedia assignment, I explored the Technologist Module from eCampusOntario. I enjoyed going through the module, and found it relevant to this course, and to teaching in general. The module serves to improve digital literacies, as it guides educators through selecting technologies to address learner-centred challenges, and to enrich learning experiences. The module encourages educators to find what digital literacy means to them, then provides a step by step guide following the design thinking approach.

In relation to my teaching experience, I can appreciate the ideas that this module presents. As a teacher, I was always trying to think about what the students would enjoy, and what they may need to be successful. The empathize section of the module was useful in this regard, as it suggested the use of a mind map. I had not thought about using a mind map for this purpose before, so it was very eye opening.
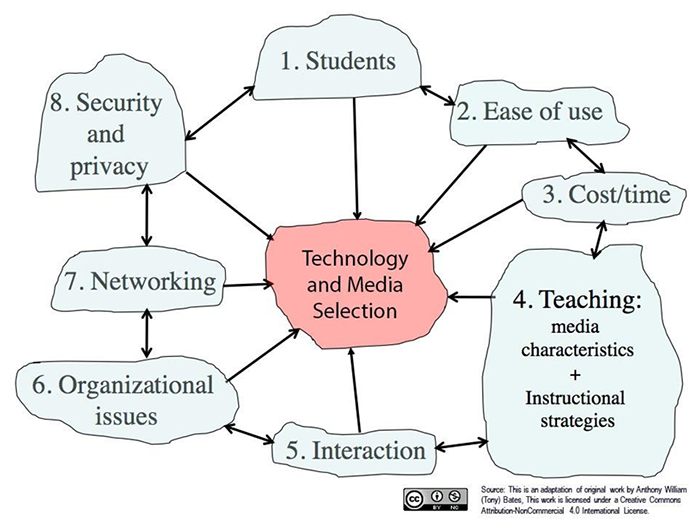
As a learner, I can understand the relevance of this module. I can recall experiences when technology has been both beneficial, and not so beneficial, within the classroom. The Technologist Module guides educators through defining learner challenges, and finding a solution that is evidence based rather than just a trendy idea. One aspect of the module that I found useful, but did not include in my artifact, was the SECTIONS framework within the ideate section. The SECTIONS framework serves as a guide for educators as they assess their chosen tools, and ensure that they are a good fit. The Technologist Module also provides significant ideas for creating a Prototype, as well as methods to Connect and share your creation.
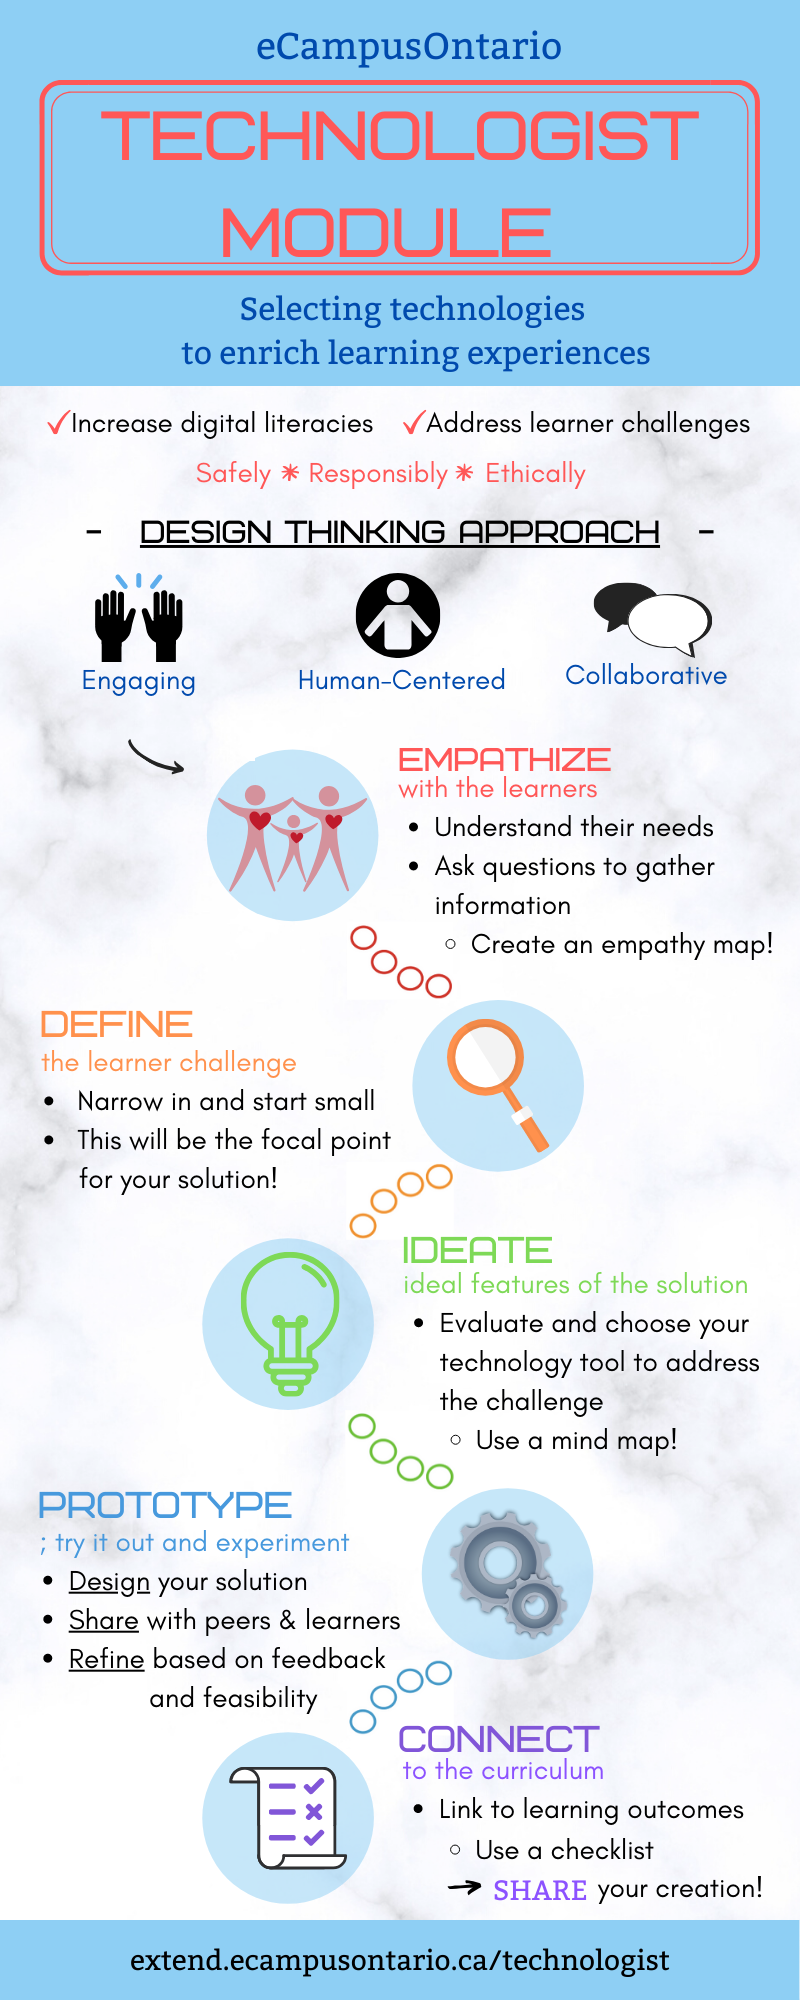
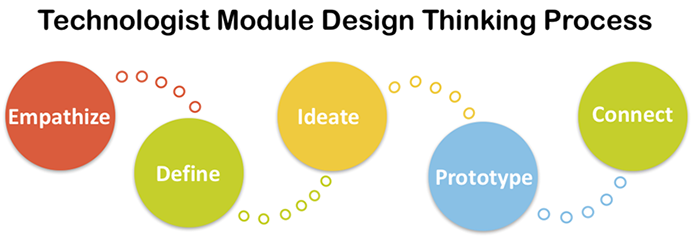
After completing a twitter essay for the first assignment, I decided to create an infographic this time around. I used Canva because I have had some experience with it in the past. It has some great affordances as it provides free photos and clipart within the website, as well as templates for infographics. Ultimately, I decided not to use a template, but rather create my own design inspired by the “Technologist Design Thinking Process” visual by Joanne Kehoe, found within the module and pictured below.
While I was comfortable with using Canva, creating an infographic proved to be more challenging than I expected. It required finding a balance between words and images that was visually appealing. I also had to decide how much text to include, and what information from the module was the most relevant. I certainly came out of this experience with new perspectives that will benefit my creative approach in the future.
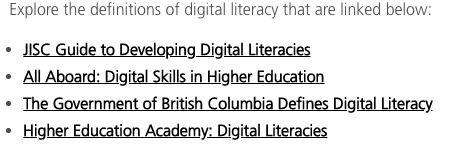
My approach when creating this artifact was to summarize the key points of the module for the purpose of giving viewers a quick glimpse into what the module entails. I went through the design thinking approach because this is the most practical part of the module that educators would participate in. I also thought it was important to start by outlining some of the overall goals of the module. However, the module itself provides many additional resources to explore digital literacy.
Overall, I feel that creating this infographic was a beneficial learning experience. It is definitely something that I would consider having my students do as a future teacher!